
We don’t like deciding by hearsay either.
Published Oxbridge admissions data mostly stops at university level. But what actually decides which college a student should apply to — how many mainland applicants a college took in recent years, roughly where the interviewed ones scored, how it runs its interviews — the University does not hold, because the colleges are separate legal bodies and run their own interviews. So we ask them one at a time.
The undergraduate admissions reports both universities publish each year: by course, by country, with the funnel. Public to everyone; this is the baseline.
Freedom-of-Information requests to the universities. These give applications, offers and test averages by college — but never the interviews.
Submitted to and answered by each college separately. Interview numbers, applicant-level test bands, admissions by subject route: this layer exists nowhere online.

Some of the response letters. The text and the requester’s name are blurred: these letters contain applicant-level data and are not for public display — they appear here only to show where the data comes from. Kingsbridge has no partnership with or affiliation to Oxford, Cambridge or any college; these are simply the replies we received after making requests under the Act.
More data does not mean a probability.
We will not produce numbers like these:
…and then tell a parent “so Girton is the easiest.” Numbers like that look precise, but under the college-plus-Winter-Pool system they mix numerators and denominators from different populations. What we actually compare: application volume and trend, the test-score pool for that subject route, the verifiable year-on-year Pool/Offer structure, how the college runs its interviews, how this applicant fits it — and how strong the evidence behind each of those is.
A fifty-three-page college strategy report.

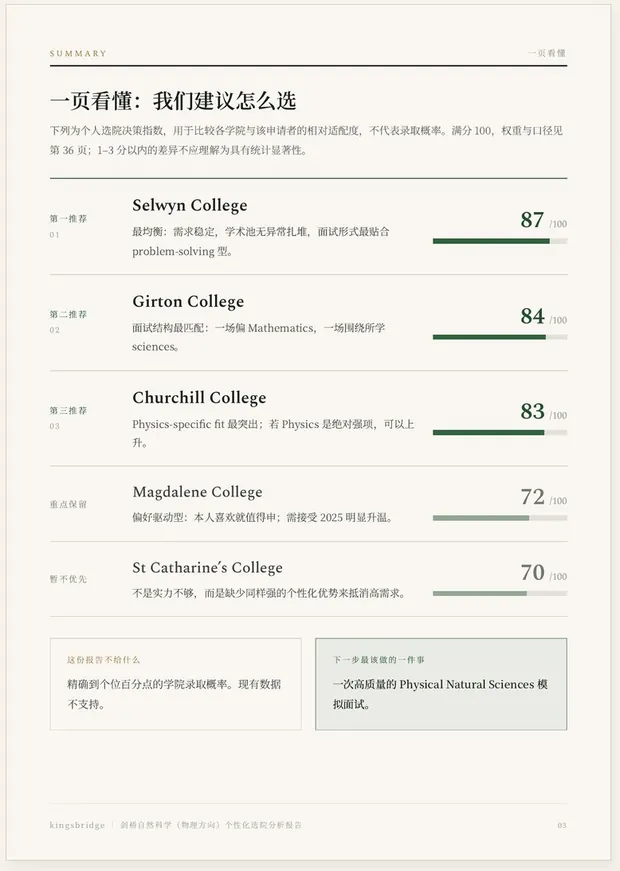

These are pages from a real report. No name, school or personal detail appears in it — the report is written anonymously by design. Data informs decisions; it does not guarantee outcomes.